
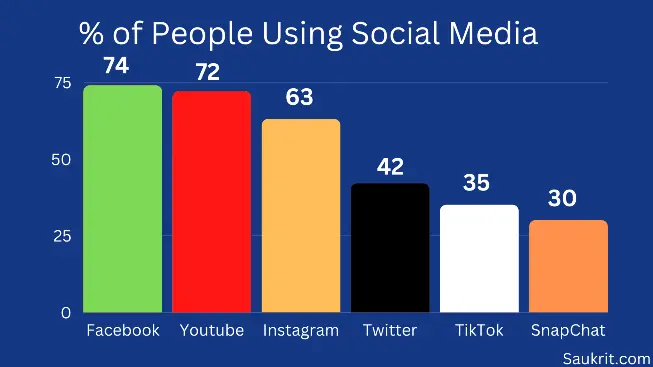
We are living in a Digital era where social media play a prominent role in our life
Now social media is part of our day-to-day life
We use it on a regular basis to be connected with our friends and the world
Social media impact on our social and mental status
But digital marketers use it in different ways
They used it for content marketing and product selling
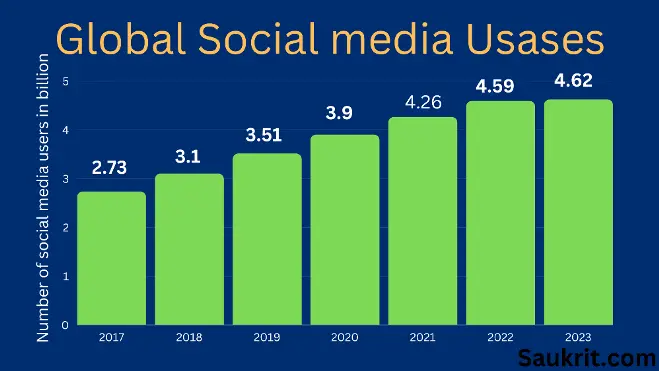
Due to its vast user base that is 4 billion where search engine receives 3.5 billion search quires per day
And it’s growing every year
Even nowadays you get an android mobile phone with preinstalled social media apps.
Let’s know some statistics and facts about social media
Social media statistics including all social media apps and website
1- The user base of social media is 4.62 billion
2- Growth of social media has been 12% per year since 2012
3- New user growth rate was measured at 13.5 every single second in 2021
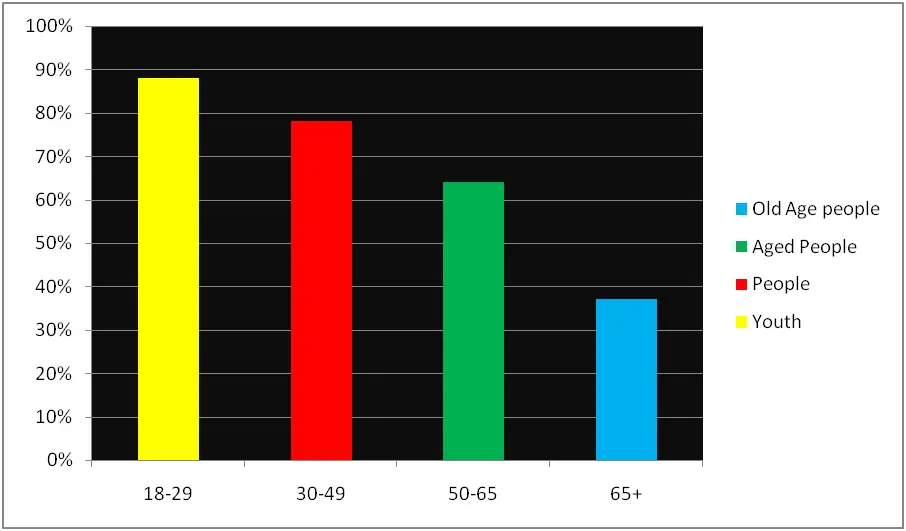
4- The age group of users is 13+
5- 75% of the world’s population uses social media
6- 93% of regular internet users use social media
7- 72% of USA citizen uses social media
8- 82.9% of Indian mobile internet users use social media
9- 4.3% of Indian desktop internet users use social media
10- 9.7% of Indian internet users (658 million) use both mobile and desktop
[Source] [Source][source][Source]
Social media usages statistics
11- Worldwide, The average use of social media is 2 hours and 27 minutes per day per person
12- During covid period Uses of social media increases
13- People of Nigeria, the Philippines, and Ghana spend the most amount of time on social media
14- People of Japan, North Korea, and the Netherlands spend the least amount of time on social media
15- People in the USA spend an average of 2 hours and 14 minutes on social media
16- In a month the average user visit 7 to 8 social media platforms
17- Large section of social media users is Youth between the age of 20 to 29
18- In women large section of social media users is between the age group 16 to 24
19- People mainly use social media to be in touch with friends and family
Stats of Social media advertisement
20- Spending on social media through advertising is approx $173 million
21- Social media video Ad spending has grown by 20.1% ($24.34 billion)
22- Annual spending on social media advertising is $134 billion
23- Growth in social media Ad spending is 17%
Facebook Statistics: Leading social media platform
24- Facebook’s monthly active user base is 2.96 billion
25- Growth in user base is 2% yearly
26- In the last year 2022 third quarter recorded growth of 3%
27- 58.8% of total world internet users use Facebook
Facebook Demographic stats
28- 81% of USA adults have a Facebook account
29- Facebook has the largest audience base from India that is 349.7 million user
30- United states contribute 182.3 million user base to Facebook
31- Indonesia contributes 133.8 million user base
32- Brazil contributes 114.7 million user base
Facebook’s top user base contributor countries
| Countries | The Facebook User base in millions |
| India | 349.7 |
| United States of America | 182.3 |
| Indonesia | 133.8 |
| Brazil | 114.7 |
33- Worldwide male user contribution is 56.5%
34- Worldwide female user contribution is 43.5%
Facebook user contribution according to Gender:
| Gender | % of User contribution |
| Male | 56.5% |
| Female | 43.5% |
35- 20% of Facebook users are Man between the age group of 25-34
36- Female users between the age group of 13-17 are Facebook’s lowest demographic user
Facebook Usases statistics
37- 66% of Facebook users (Approx 1.98 billion) log in daily
38- Facebook enjoy 1st position in world social media usage
39- Users of Facebook spend 19.6 hours per month on Facebook surfing
40- Facebook gets only 0.7 unique users
41- 50% of Facebook users use Twitter also
42- The USA users spend an average of 34.6 minutes per day
43- Facebook recorded a 3% growth in website traffic
44- Facebook is the world’s third most downloaded app after WhatsApp and Instagram
45- 1.3 billion Facebook users use Facebook messenger
46- The world’s average use of Facebook is approx 36 minutes
47- 39.8% of the world’s population use Facebook every month
48- 98.5% of Facebook users use mobile devices to surf Facebook
49- 85% of smartphone users have installed Facebook aap
50- Teenager use of Facebook in the USA decreased from 71% to 32%
51- There are 10 million groups active on Facebook
52- More than 70 million Admin and moderates controlling these groups
53- 1 billion Facebook stories are shared daily
54- 49% of the adult USA population use Facebook several times a day
55- 31% of American use Facebook to read news
56- 16% of Facebook accounts are fake
Brand Stats:
57- Facebook is 7th most valuable brand in the world
58- Local business page is visited by 66% of Facebook users once a week
59- One 3rd of Facebook user use to purchase from Facebook post links and pages link
Facebook Engagement Statistics:
60- Approx 1 billion stories get posted on Facebook daily
61- Every month, 1.8 billion people participate in Facebook groups
62- 57% of the brands believe Facebook stories successfully market their products
63- Facebook interaction is increased by 600% when a video post is made
64- 9% of Facebook users upload original video content
65- 85% of Facebook videos are watched on silent
66- 81% of companies post video content on Facebook
67- The average user receives 12 likes, 5 comments, and 1 share every month
68- Every day, Facebook receives more than 4 billion video views
69- Four million likes are generated on Facebook per minute
70- Every minute, 35 million individuals update their statuses on Facebook
71- Facebook has already received more than 350 billion photo uploads
72- In the US, videos released by influencers received around 60% of all Facebook video views, while those from media companies received 30%, followed by brand/aggregator videos at 10%.
73- Facebook has the highest live video interaction rate (26%), compared to all other social media sites
74- Facebook Live was the medium of choice for live-stream purchasing by 26% of American consumers
75- Facebook Gaming view hours decreased from 1.29 billion hours of streaming in the third quarter of 2021 to just 382 million
76- Facebook videos with captions get 12% more views
77- According to the most recent Facebook statistics, links make up 49.9% of all posts, making them the most popular type of material on the site. Images and videos are displayed after this
78- The greatest engagement rate of any Facebook material is for status updates, which have a 0.14% rate
79- The average engagement rate of Facebook posts is 3.91%.
Facebook Business Stats
80- 250 million Facebook Shops exist worldwide
81- 36% of Facebook page postings are photos
82- Customers who engage in Facebook live chat are 53% more likely to make a purchase from a business
83- Over 70% of Facebook users view local business pages at least once every week
84- 18.3% of American individuals aged 18 and over have used Facebook for business in the last year
85- More than 200 million companies utilize Facebook’s free tools and applications
86- Organic reach of a Facebook Page post is 5.2%
87- 87.1% of US marketers use Facebook to promote their brand
88- Facebook shops have more than 1 billion monthly active users
89- 44% of users admit Facebook has an impact on their buying decisions
90- 80 million business pages are active on Facebook
91- 15% of Facebook users shop on Facebook
92- More than 160 million businesses use Facebook to interact with their customers
93- 84% of video marketers use Facebook to promote their videos
94- 96% of B2C marketers and 91% of B2B marketers use Facebook
Facebook Ads Facts
95- You can reach up to 2.1 billion people through Facebook Ad
96- Facebook has over 10 million active advertisers as of 2023
97- 34.1% of adults over the age of 13 in the world encounter Facebook ads
98- 63.7% of Americans over the age of 13 are exposed to Facebook ads
99- On average, Facebook charges $0.97 per click
100- Facebook ad revenue as of Q3 2022 is $82,387 million
101- On average, a Facebook user clicks on 12 ads every month
102- Audiences aged 18-24 spend 75% of their time on Facebook watching video ads
103- 71% of buyers accepted they had seen related Ads on Facebook
104- The average Facebook Ad clicks is 8 per user per month
105- 43.5 Ad watch audience if Female and 56.5 is Male
106- Facebook ads have an average CPC of $1.72, an average CTR of 0.9%, and an average conversion rate (CVR) of 9.21%
107- Adding a CTA button boosts the conversion rate by 2.85 times
108- A CTA in the middle of the video has witnessed a higher conversion rate of 16.95%
INSTAGRAM STATISTICS
Let’s Get another popular social media statistics
User and usages Statistics
109- Instagram is the fourth most popular social networking platform in the world, with over 1.5 billion members
110- Instagram ads currently reach over 30% of internet users.
111- The average monthly usage of Instagram is 11.2 hours worldwide
112- the top usage rate is 20.2 hours per month in Turkey
113- the lowest usage rate is 5.8 hours per month in South Korea
114- 91% of active Instagram users indicate that they watch videos on the platform on a weekly basis
115- 50% of Instagram users claim that they have gone through to a brand’s website after reading their Stories
116- 59% of US adults use Instagram daily
117- Instagram drives conversions. 92% of users say that they’ve acted in the moment after seeing a product on Instagram.
118- Ads are most likely to reach men and women between the ages of 18-34
119- The most popular hashtag on Instagram is #Love, followed by #Instagood and #Fashion
120- Instagram users increased by 5.79% a year from 2022 to 2023.
121- It is anticipated that Instagram’s user growth would approx 5.47% in 2024.
122- Instagram is the fourth most used social media platform worldwide
123- Instagram’s monthly active user base is equal to the combined populations of the EU and North America
124- 30 minutes is the average period of time spent on Instagram
125- It’s estimated that 95 million platform users (9.5%) are bots, which would cost marketers $1.3 billion
126- About 30.94% of the 4.48 billion internet users globally use Instagram on a regular basis
127- Instagram has 69 million more daily active users than all of South America
128- 21% of users log in once a week, while 16% do so less frequently
129- 38% of users log in to the platform multiple times
130- 70% of people watch Instagram stories daily
131- 71.9% of the content on Instagram is photo posts
132- 130 million users tap on shopping posts each month
133- 40% of Instagrammers post stories daily
Instagram Demographics statistics
134- Instagram users are mostly between the ages of 25-34
135- The Male user of instagram is 56.5 and Female user is 33.5
136- 70% of Instagram users are under 34
137- 25.31% of people worldwide use Instagram
138- Daily active users of Instagram stories are 500 million
139- 87% of Instagram users reside outside of the United States
140- The highest number of users of Instagram is in India (230.5 million), the U.S. (159.75 million), and Brazil (119.45 million)
Instagram Engagement Stats
141- The average engagement rate for photo posts is 0.81%, video posts are 0.61%, and carousel posts are 1.08%
142- The highest Instagram Reels engagement rates are obtained by Instagram accounts with fewer than 5,000 followers, reaching up to 3.79% on average
143- On Instagram, reels receive 22% more interactions than regular video postings
144- The amount of time people spend watching videos on Instagram has increased by 80%
145- A total of 4.2 billion likes occur on Instagram each day
146- Longer captions get better engagement
147- On average, 10.7 hashtags are used in Instagram posts
148- Compared to Facebook, Instagram has 58% greater engagement per follower
149- People spend almost 30 minutes per day on Instagram, according to statisti
150- Photos with faces perform almost 40% better than those without faces
151- When compared to photos, videos receive 21.2% greater interaction
152- Every month, 2 billion people engage with insta reels
153- On weekdays, Instagram users engage more, with Wednesday and Thursday exhibiting the highest levels of engagement
154- The average engagement rate for business accounts with under 10,000 followers is 1.11%.
155- The engagement rate for business accounts with 10,000–100,000 followers is 0.93%.
156- Users like 4.2 billion posts on Instagram each day
157- Posts with tagged locations get 79% more engagement than those without tags.
Instagram Business Stats
158- More than 25 million businesses use Instagram to promote their services and products.
159- US-based online stores lead with 86% Instagram accounts, followed by 81% accounts from the U.K. and 75% from Germany-based online stores.
160- 90% of accounts follow at least one business on Instagram.
161- 62% of users say they are more interested in a brand after seeing it in an Instagram Story.
162- 81% of Instagrammers use the platform for researching new products and services.
163- 87% of Instagram users say they take action after seeing a product on Instagram.
164- On average, major brands post on Instagram 1.5 times every day.
165- 98% of fashion brands use Instagram
166- Over 150 million people use Instagram to communicate directly with a business monthly.
167- 68% of weekly Instagram users visit the platform to interact with creators.
168- 93% of marketers have already used Instagram to acquire potential new customers.
169- 74% of marketers want to reach a new target audience, 69% want to improve brand awareness, and 46% want to increase sales.
170- 54% of all influencers on Instagram are nano-influencers, while 33% are micro-influencers.
171- 61% of consumers trust influencer recommendations more than brand content (38%).
172- Nano-influencers are also on the rise, with the highest engagement rate, at 5%.
173- 36% of businesses use stories to promote their products.
174- 98% of fashion brands use Instagram.
175- 67% of users watch branded stories.
176- 73% of marketers are in favour of Instagram for influencer marketing.
177- The average monthly follower growth of business accounts on Instagram is +1.46%.
178- There are 500,000 active influencers on Instagram.
Insta Ad Stats
179- Instagram ads have the potential to reach 849.3 million users.
180- Instagram marketers spend 69% of their budget on influencer marketing on Instagram.
181- Micro-influencers, who generally have 50,000 – 100,000 fans, are used by businesses to advertise their products.
182- The U.S. has the highest potential Instagram advertising reach, followed by India and Brazil.
183- Instagram Stories ad revenue is expected to increase to 20.03 billion dollars in 2023.
184- The highest Instagram advertising audience is from the 25-34 age group.
185- Instagram’s advertising audience grew by 20.3%.
186- 83% of consumers claim they use Instagram to discover new products or services.
187- Instagram’s bogus bot accounts cost marketers an estimated $1.3 billion yearly in the advertising ecosystem.
188- With Instagram, the average post will cost you between $100-$2,085.
189- Video ads have 3x more engagement than photos.
Pinterest Statistics
Find pinterset stats
Pinterest Demographics Stats
190- Pinterest has 445 million monthly active users worldwide.
191- With 86 million MAUs, the United States has the highest number of Pinterest users.
192- The US was followed by Brazil with 27 million users (though they only account for about 8% of the traffic to the website) and Mexico with nearly 18 million users.
193- 44% of the website traffic comes from the US.
194- Females make up more than 75% of the users on the platform.
195- Women between the ages of 25 and 34 account for 29.1% of Pinterest’s global audience.
196- Over 16% of Pinterest’s user base are women in the 18 to 24-year age group.
197- Compared to Snapchat, TikTok, and Instagram, Pinterest, like Twitter and Reddit, had significantly fewer Gen Z users in 2022.
198- 31% of millennials in the UK with a household income of over £100K are on Pinterest
199- More than 75% of Pinterest users are from outside the U.S.
Pinterest Usage Stats
200- More than 2 billion searches happen on Pinterest each month.
201- People watch close to 1 billion videos a day on Pinterest.
202- 82% of users use Pinterest on its mobile app.
203- Per every Pinterest visit, 5.5 pages were visited, and the average visit duration was almost six minutes.
204- 77% of their users on Pinterest are loyal to the brand.
205- UK Users Spend Less Than an Hour on Pinterest Per Day.
206- 85% of Pinners say they use Pinterest to plan new projects.
207- The average Pinterest user types in 8 searches per month.
208- Pinterest users, in general, spend 29% more while shopping than non-users.
209- In Q3, Gen Z users grew double digits year over year, accelerating from Q2.
210- 86% of millennials use Pinterest to plan life events.
211- 63% of millennials use the platform to search for products and services.
212- Over 75 billion pins have been uploaded to Pinterest.
213- High-income households are twice as likely to use Pinterest as low-income households.
Pinterest Engagement Stats
214- Pinterest trends outperform other internet trends by 21% each month.
215- 60% of users log on to “view pictures” on Pinterest.
216- Posting is most effective around noon and at night.
217- Pinners are 5x more likely to purchase from Try On-enabled Pins than standard Pins.
218- Pinterest active users have saved more than 200 billion Pins altogether.
219- 98% of users have tried something they’ve seen on Pinterest.
220- The average number of pins made by an active female user is 158.
221- Dads are 3x more likely to have shared boards than the average male pinner.
222- Descriptions that are 100-200 characters in length gain more popularity.
223- Pins in the fashion category are most popular on Thursday.
224- A Pin including a specific call to action increases engagement by 80%.
225- Video views on Pinterest have increased by 200%.
226- 78% of Pinterest users say seeing brand content on the platform is useful.
227- 55% of people use Pinterest to shop and buy.
229- 89% of U.S. pinners use Pinterest for inspiration in their path to purchase.
230- 98% of the users have tried something they found on Pinterest.
231- Pinterest is most popular with women—especially moms.
232- Related Pins account for 40% of engagement on Pinterest.
233- More than 56 million pinners actively engage with home content.
234- 70% use Pinterest to find accessories, watches, and jewelry.
235- 52% use their platform to develop their knowledge of great food and drinks.
236- Dads are 3x more likely to have shared boards than the average male pinner.
237- 80% of moms use Pinterest.
238- Pinterest trends increased to 56%, while the rest of the platforms rose to 38%.
239- 600 million visual searches occur via the Pinterest lens every month.
Pinterest Business Stats
240- Compared to Facebook, Pinterest sends 33% more traffic to e-commerce websites.
241- 55% of people use Pinterest to shop and buy.
242- For every $1 spent on Pinterest marketing, sales are generated at a rate of $4.30.
243- 61% of Pinners in the UK have gone shopping as a result of seeing branded content.
244- 78% of users believe branded content to be helpful.
245- Shopping is a top priority for 48% of Pinterest users.
246- In Q3 2022, Pinterest generated $685 million in revenue, of which $575 million came from the US & Canada alone.
247- Shoppers on Pinterest spend twice as much monthly than social shoppers on other platforms.
248- The global Pinterest revenue has increased by 8% y-o-y growth.
249- 46% of weekly Pinners have discovered a new brand or product on Pinterest
250- Interaction with organic Pinterest shopping pins has increased by 44%.
251- 87% of people on Pinterest have bought a product because of Pinterest, while 93% use Pinterest to plan a future purchase.
252- 76% of pinners save items to purchase later.
253- 97% of all searches on Pinterest are unbranded.
254- Pins that show a product or service in action are 67% more likely to drive sales.
255- 85% of pinners put visuals first when shopping for apparel and furniture.
Pinterest Ads Insights
256- 61% of Pinterest users have purchased after seeing a sponsored pin.
257- Pinterest’s Ad Revenue Is Expected to Exceed $4 Billion by 2026.
258- On Pinterest, advertisers may reach more than 200 million users.
259- Compared to other social platforms, Pinterest’s shopping advertisements generate three times as many conversions and a 2X increase in the positive incremental return on ad expense.
260- Ads that use “lifestyle” photographs have a 32% greater click-through rate than those that use “stock” product images.
261- The highest reach ranking of Pinterest is witnessed in the U.S., followed by Brazil and Mexico.
262- The majority of ad audiences on Pinterest are from the age group of 25-34, which constitutes 38.8% of all Pinterest users.
263- Quarter-on-quarter change in Pinterest’s advertising reach is +4.4%.
264- 78% of users say content from brands is useful, including ads.
TWITTER STATISTICS
Get Twitter stats
Twitter Demographics Stats
265- Twitter has 368 million monthly active users.
266- The U.S. leads in terms of population with 76.9 million users, followed by Japan and India with 58 and 23.6 million users, respectively.
267- Twitter has a 56.4% male audience and a 43.6% female audience.
268- Most of Twitter’s audience (38.5%) is between the 25 to 34 age group. People aged between 13 to 17 years make up just 6.6% of the Twitter user base.
269- 25.47% of Twitter’s traffic comes from the United States.
270- Most of Twitter’s audience (38.5%) belongs to the 25 to 34 age group.
271- Twitter’s brand value growth rate in 2022 is 85%.
272- Twitter is the 15th most popular social media in the world in terms of users.
273- 7.1 billion people visited Twitter.com this year.
Twitter Usage Stats
274- The Twitter user spends 5.1 hours a month on Twitter. If we break it down, it means that an average Twitter user spends 10 minutes on the platform daily.
275- One-fifth of Twitter users below the age of 30 visits the platform frequently to update themselves on their favorite topics.
276- 25% of users use the app every week, while 71% visit at least weekly.
277- 55% of Twitter users access the platform regularly to get news.
278- 69% of Twitter users in the U.S. use the platform to get news.
279- 57% of U.S. citizens who catches news on Twitter believe the platform has increased their understanding of current events.
280- 96% of Twitter Users in the U.S. Report Using the Platform Monthly.
281- 30% of Twitter users said that the platform has made them politically aware.
282- 82% of Twitter users access the platform for entertainment purposes.
283- 6000 tweets are sent in one second.
284- 80% of active users access Twitter via smartphones.
Twitter Engagement Stats
285- People Tweet about soccer more than any other sport on Twitter.
286- Twitter Ranks as the 15th Most Popular Social Network.
287- 79% of marketers have continued leveraging Twitter Spaces.
288- The average number of hashtags used each day on Twitter is 125 million.
289- Using 1-2 hashtags can get you 21% more engagement.
290- Tweets with more than 2 hashtags might have 17% lesser engagement.
291- Hashtagged tweets have a 55% more chance of being retweeted.
293- A user on Twitter has an average of 707 followers.
294- 391 million people on Twitter have no followers at all.
295- The top 10% of tweeters contribute 92% of tweets in the U.S.
296- Twitter’s timeline generates +31% higher emotional connection and +28% higher levels of memorability versus the social media average.
297- “Face with Tears of Joy” is used 14.5 billion times, making it the most-used emoji on Twitter.
298- Tweets with a GIF gain 55% more engagement than those without.
299- People watch 2 billion videos on Twitter daily.
300- Tweets with hashtags have witnessed engagement by 100% for individuals and 50% for brands, as per the latest hashtag stats.
Twitter Business Stats
301- 16% of internet users aged 16-64 use Twitter for brand research.
302- According to Twitter, “a 10% increase in Twitter Spaces discussion rooms has resulted in a 3% increase in sales volume.”
303- 77% of Twitter users feel more positive about brands that are community and society focused.
304- 67% of B2B marketers use Twitter as a digital marketing tool.
305- 54% of Twitter’s audience is more likely to purchase new products.
306- Twitter has 41.5 million monetizable daily active users in the United States.
307- Twitter generated $1.18 Billion in revenue in the second quarter of 2022.
308- Twitter has a market cap of $29.56 billion as of September 2022.
309- 40% of Twitter users purchase a product after coming across it on the platform.
310- 85% of SMB users on Twitter say providing customer service is important.
311- 53% of Twitter users will likely be the first purchasers of new products.
312- Companies using Twitter for customer service see a 19% lift in customer satisfaction.
313- 50% of consumers use Twitter, while 36% follow brands on Twitter.
314- 40% of the users admitted purchasing something they saw on Twitter.
315- 92% of companies tweet more than once a day.
316- 93% of brand followers on Twitter plan to buy from them.
317- 69% of brand followers on Twitter have already purchased from them.
Twitter Ads Insights
318- Twitter’s cost-per-mile (CPM) is the lowest of all the major platforms.
319- In Q2 of 2022, Twitter’s advertising revenue totaled $1.08 billion, an increase of 2%.
320- The forecasted value of Twitter 2022 (Q4) ad revenue has slumped to $1.1 billion from $1.41 billion.
321- Twitter ads reach 5.8% of the world population over the age of 13.
322- Twitter’s First View feature increases video viewing time by 1.4x.
323- Average Twitter Ads ROI is 40% higher than other Channels.
324- The Cost-per-engagement (CPE) on video adverts is now 50% lower.
325- Twitter has a potential ad reach of 544.5 million.
326- In 2022, Twitter’s ad revenue in the EMEA region decreased by 15%, and the company saw a 49% decline in advertising bookings for November.
327- Ads with no hashtag received 23% more engagement.
328- 29.6% of ad audiences are female, and 70.4% are male.
329- The highest reach ranking of Twitter ads is witnessed in the U.S., followed by Japan.
330- The majority of ad audiences on Twitter are males from the age group of 25-34 and females from the 18-24 age group.
331- Advertisers saw a rise of 89% in video completion rates.
332- Around 164 million ads are shown on Twitter daily.
Linkedin Stats
Get Linkedin stats
LinkedIn Demographics Stats
333- 57.2% of LinkedIn users are males, while 42.8% are females.
334- People aged 25-34 account for 59.1% of the LinkedIn user base.
335- Over 75% of LinkedIn users are based outside the United States.
336- 52.1% of LinkedIn users from the United States of America are males, while 47.9% are females.
337- A study done in Q3 2022 revealed that 40% of internet users aged between 46-55 access LinkedIn.
338- Internet users aged between 15-25.
339- Millennials make up 20.4% of LinkedIn’s user base worldwide.
340- 9 million people have turned on the creator mode since its launch in 2021.
341- There are over 17 million opinion leaders on LinkedIn.
LinkedIn Usage Stats
342- Linked In has 875 million users worldwide, out of which over 310 million are monthly active users.
343- LinkedIn has the most users from the Asia Pacific region, accounting for over 230 million users.
344- The number of LinkedIn users is projected to reach over 1 billion by 2025.
345- 95 job applications are submitted on LinkedIn every minute.
346- 50 million people use LinkedIn to look for jobs every week.
347- On average, 6 people are hired via LinkedIn each minute.
348- 57% of LinkedIn’s traffic is generated via smartphones.
349- 30% of a company’s LinkedIn post engagement comes via their employees.
350- Employees have a 14x more chance of sharing a post from their employer.
351- 16.2% of users access LinkedIn via its application daily, while 48.5% do so monthly.
352- LinkedIn witnessed 15.4 billion sessions in the third quarter of 2022.
353- A LinkedIn post with an image gets 2x the engagement rate.
354- The United States accounts for 31.16% of LinkedIn’s traffic.
355- LinkedIn is used by professionals in 200 different countries worldwide.
356- Most LinkedIn users are aged between 25 and 34.
357- 49% of LinkedIn users earn $75,000+ per year.
358- 37% of millionaires are LinkedIn members.
359- Over 90% of Fortune 500 companies use LinkedIn.
360- LinkedIn is more popular with males than females.
361- 180 million people use LinkedIn in the USA.
LinkedIn Engagement Stats
362- 22.04% of LinkedIn traffic comes from search alone.
363- 99.63% of LinkedIn search traffic comes from organic search.
364- LinkedIn Pages with complete information get 30% more weekly views compared to others.
365- Each week, 45 million people look for a job on LinkedIn.
366- More than 14 million open jobs are posted on LinkedIn Jobs.
367- 200+ million jobs are submitted on LinkedIn each month.
368- 4 people get hired on LinkedIn each minute.
369- There is a 50% rise in engagement year-over-year on LinkedIn.
370- Companies posting weekly see an engagement rise by 2x on LinkedIn.
371- 98% of marketers on LinkedIn agree that personalization helps advance customer relationships.
372- According to LinkedIn, companies that post 20 times per month reach at least 60% of their unique audience.
373- Including the links in a post can drive twice the engagement than a post without it on LinkedIn.
374- Images, on average result in a 98% higher comment rate than without on LinkedIn.
375- Links to Youtube videos play directly in the LinkedIn feed and typically give a 75% higher share rate.
376- Linkedin accounts with completed and updated information gain 40 times more opportunities.
377- Long-form content gets the most shares on LinkedIn, so aiming for between 1700-2100 words should give your content a boost.
378- LinkedIn articles with 8 images and 5 to 7 or 9 headlines are best for engagements.
379- Messages sent have increased by 35% year-over-year on LinkedIn.
380- Weekly LinkedIn members who engage heavily with content are 5x more likely to return daily.
381- Listing 5 or more skills on your LinkedIn profile can lead to up to 17x more views.
LinkedIn Business Stats
382- More than 57 million companies are listed on LinkedIn.
383- 46% of social media traffic to the company’s website comes from LinkedIn.
384- 45% of marketers have gained customers through LinkedIn.
385- Lead Gen Forms on LinkedIn can increase conversions by 3x.
386- 89% of B2B marketers rely on LinkedIn for lead generation.
387- 62% of B2B marketers generate leads on LinkedIn successfully, over double the next-highest social channel.
388- 4 out of 5 LinkedIn users drive business decisions.
389- 52% of buyers list LinkedIn as the most influential channel during their research process.
390- InMail has a 300% higher response rate than email, with a 10-25% hit rate on LinkedIn.
391- LinkedIn is generating revenue for 38% of B2B marketers.
392- 80% of B2B leads coming from social media are from LinkedIn.
393- 97% of B2B marketers use LinkedIn to help drive their content marketing strategy.
394- 92% of B2B marketers have LinkedIn included in their digital marketing mix.
395- 15% of Linkedin users are senior-level influencers.
396- As per Linkedin, an average of 10 content pieces are considered before making a purchasing decision.
LinkedIn Ads Insights
397- 790.4 million people can be reached with adverts on LinkedIn.
398- An ad on LinkedIn can reach 14.3% of the world’s population over 18 years of age.
399- Quarter-on-quarter change of LinkedIn’s advertising reach is +2.9%.
400- 43.4% of ad audiences are female, and 56.6% are male.
401- Sponsored InMail has an opening rate of 52% on LinkedIn.
402- The U.S. offers the largest group of LinkedIn advertising audiences, with a reach of 170 million users.
403- LinkedIn Message Ads have a 40% conversion rate.
404- 65% of B2B companies have generated a customer through LinkedIn paid ads.
405- The cost per lead is 28% lower than on Google AdWords on LinkedIn.
406- Lead Gen forms on LinkedIn have reduced the cost per lead for 90% of B2B marketers.
407- LinkedIn has reported that its “matched audience” targeting feature procured a 32% increase in post-click conversion rates and a 30% boost in CTR.
408- 58% of B2B advertisers like the ROI of LinkedIn ads.
409- The average conversion rate of video ads on LinkedIn for the U.S. is 6.1%, more than any other contemporary platform.
TIKTOK STATISTICS
TikTok Demographics Stats
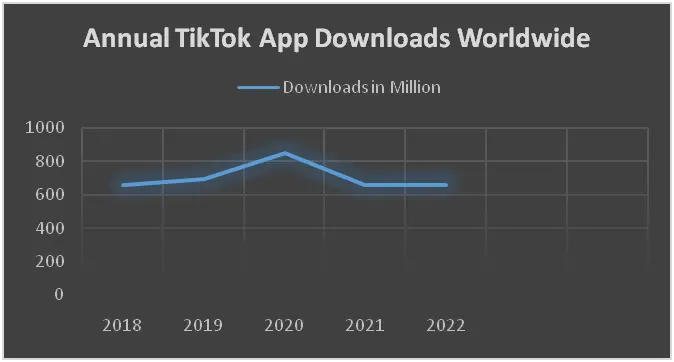
410- TikTok has over a billion monthly active users worldwide.
411- TikTok is now available in more than 200 countries.
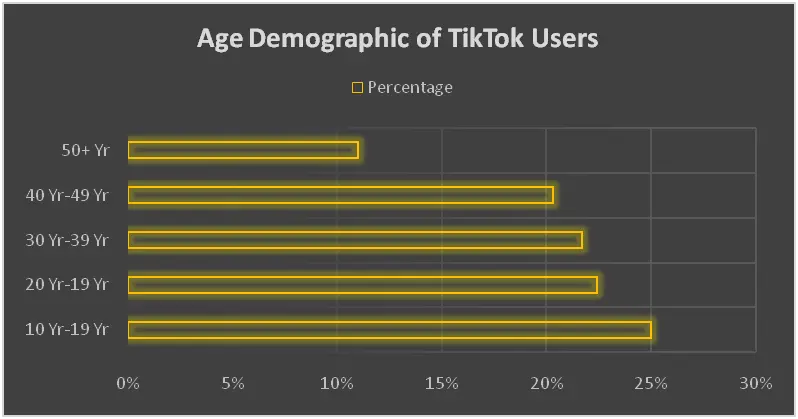
412- 52.38% of TikTok’s population worldwide are between the ages of 18 and 24.
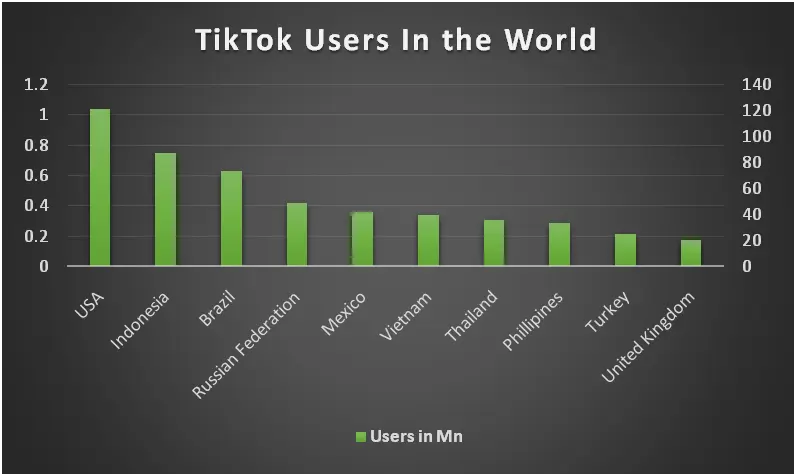
413- The United States (136.5 million), Indonesia (99 million), and Brazil (74 million) have the largest audiences on TikTok.
414- As of April 2021, TikTok usage was highest among adults aged 18-29 at 48%, followed by 30-49 year-olds at 20%, and then 50-64 year-olds at 14%.
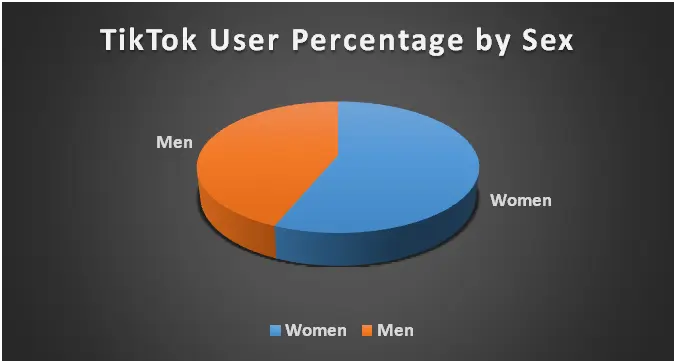
415- 57% of TikTok’s global users are Female, and 43% are Male.
416- Females in the age group of 18-24 account for a 24% share of TikTok’s audience, while males of the same age add up to approximately 18%.
417- 60% of TikTok users GenZ.
TikTok Usage Stats
418- Android users spend 19.6 hours per month on TikTok.
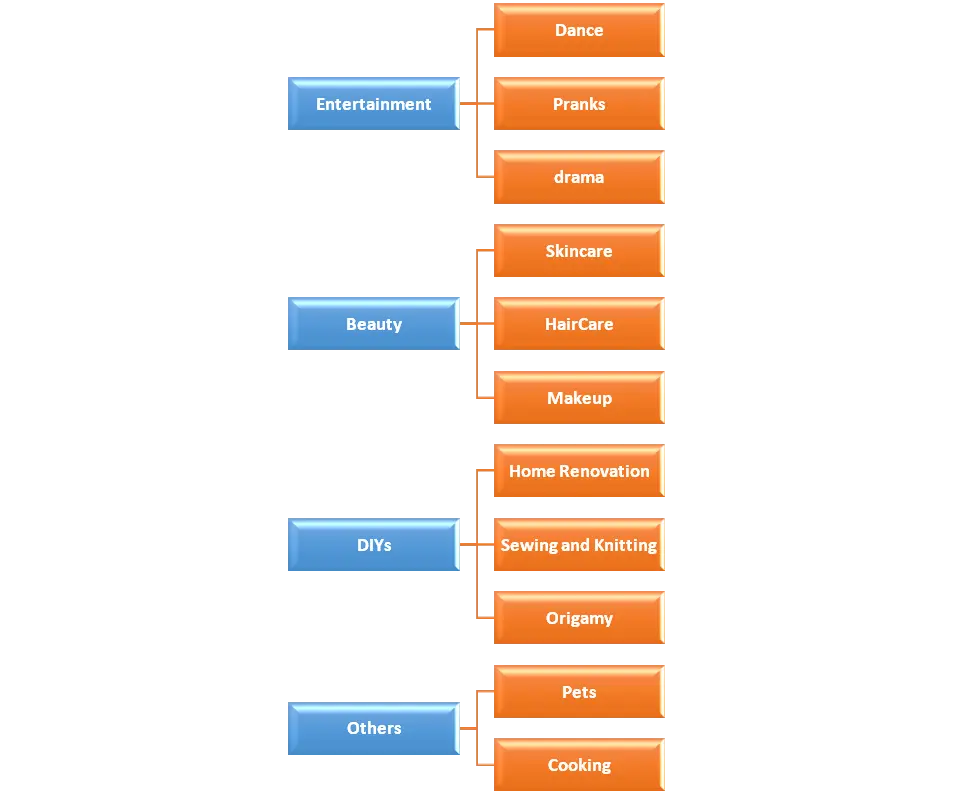
419- The majority of people use TikTok to find funny/entertaining content.
420- TikTok has 120.5 million monthly and 30.8 million daily active users via iOS.
421- TikTok has 15.54 million daily active users and 30 million monthly active users via Android.
422- The average user opens TikTok 19 times per day.
423- Children between 4-15 years spend 91 minutes on the app.
424- According to eMarketer, 61.3% of the Gen Z population in the US access TikTok on a monthly basis.
425- The U.S. users alone spend almost 500 minutes monthly on TikTok.
426- There are over 100 billion average monthly video views on TikTok.
427- Over 34% of TikTokers shoot daily.
428- 90% of all TikTok users access the app on a daily basis.
429- 68% of TikTok users watch someone else’s video.
430- 55% of TikTok users upload their own videos.
431- 41% of users have uploaded their reactions to other videos on TikTok.
432- 87.3% of videos have at least one hashtag.
TikTok Engagement Stats
433- In the last year, more than 1 billion videos have been viewed every day on the app.
434- 64% of Tik Tok users have tried face filters or lenses.
435- Some 35% of TikTok users have participated in a hashtag challenge.
436- The average engagement rate on TikTok is 5.95%.
437- 90% of TikTok users open the app multiple times.
438- 43% of users have taken part in duets.
439- The most viewed content category was “Entertainment” on TikTok, having a whopping 545 billion hashtag overall views.
440- The hashtag “fyp” is the most used hashtag.
441- 90% of TikTok users reported that sound is an essential aspect of the TikTok experience.
442- 63% of engaged TikTok users claim to have liked a video in the last month.
443- 54% of engaged TikTok users claim to have commented on somebody else’s video.
444- According to Upfluence, micro and mega influencers on TikTok had an engagement rate of 17.96% and 4.96%, respectively.
TikTok Business Stats
445- Consumer spending on TikTok has surpassed $2.5 billion globally.
446- TikTok buyers in the US increased by 72.3%, reaching a total of 23.7 million.
447- 42% of all TikTok revenue now comes from the U.S.
448- 50% of TikTok users who
449- TikTok influencers with 2.5 million followers charge around $800 per post.
450- Bytedance, TikTok’s parent company, has seen a drop in its valuation compared to the 2021 number of $ 400 billion to $300 billion last year.
451- Brands post an average of 3-4 posts weekly.
452- 50% of TikTok users have bought something after watching TikTok LIVE.
453- 1 in 3 Tiktok live users considers TikTok their go-to place to connect with brands.
TikTok Ads Insights
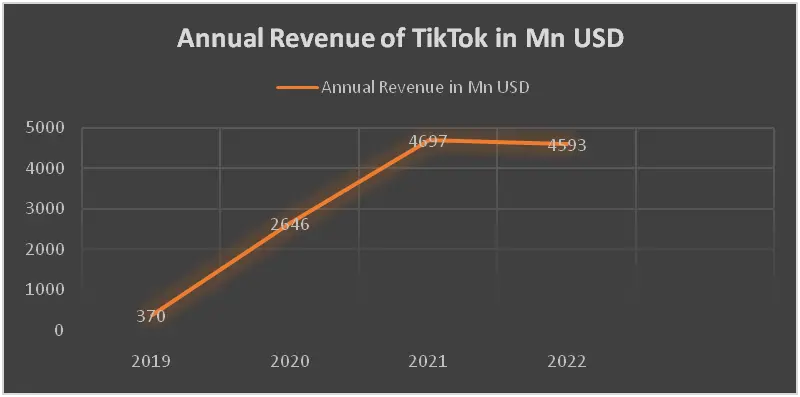
454- In 2022, TikTok’s revenue from advertising saw a significant increase of 200% year over year, reaching a total of $11.04 billion.
455- TikTok has an ad reach of roughly 885 million people.
456- TikTok offers five advertising tiers aimed at big brands. One of which, a branded hashtag challenge, reportedly costs $150,000 per day.
457- TikTok ads reach 17.9% of all internet users aged 18+.
458- 63% of All Successful TikTok Ads Communicate Their Message Right Away.
459- Partnering with creators boosts view-through rates by 193%.
460- TikTok Ads reach 25% of Female Gen Z users and 17.9% of male Gen Z users.
461- TikTok’s ad revenue is greater than Snapchat and Twitter combined.
462- A brand takeover can cost anywhere from $50K to $100K daily, with 5 million impressions guaranteed on TikTok.
463- With TikTok video ads, you can send users to a landing page, an app page, or your website.
464- 90% of branded hashtag challenges generate 2.5X ROI on ad spend.
465- Challenges with hashtags cost brands $100,000+ on TikTok.
466- TikTok ads start at $10 per 1000 views with a $500 minimum per campaign.
467- 61% of TikTokers mentioned that they tend to buy from brands they see advertised, and 63% consider themselves brand conscious.
468- Brands are currently buying TikTok’s in-feed ads for $10 per impression with a $6,000 minimum campaign spend.
469- Brands create 3.7% of the content on TikTok.
470- 33% of customers respond better when ads refer to them directly on TikTok.
471- 50% of ads have emotional messages.
SNAPCHAT STATISTICS
Snapchat Demographics Stats
472- Snapchat daily active users have increased by 19% year-over-year to 363 million.
473- Snapchat has over 557 million monthly active users, as per Statista.
474- 1.4% of internet users ages 16 to 64 call Snapchat their favorite social media app.
475- Snapchat is the world’s 12th most popular social media platform.
476- As of April 2022, India boasts the largest Snapchat user base, with a total of 144.35 million users.
477- Females make up 52.9% of Snapchat’s global user base.
478- In the United States, the 15-25 age group represents the largest portion of Snapchat users at 48%.
479- Users between the ages of 26-35 make up 30% of the platform’s user base, while those between 36-45 represent 18%, ages 46-55 make up 11%, and users 56 and above make up just 5%.
Snapchat Usage Stats
480- The average user devotes 21 minutes per day and 3 hours per month to using the Snapchat platform.
481- People who use Snapchat open the app 30 time a day.
482- 4 Billion+ snaps are sent every day on the platform.
483- A majority of Snapchat’s daily active users, 63%, use augmented reality (AR) filters.
484- It is reported that an average of 5+ billion snaps are created on the platform daily.
485- 82% of American teenagers use Snapchat at least once a month.
486- The Snap Map feature on Snapchat is used by over 250 million users on a monthly basis.
Snapchat Engagement Stats
487- The number of Snap Stories that include music has increased by more than 3X.
488- Since January 2021, over 250 million Snapchat users have been using AR shopping Lenses.
489- Snapchat received a customer satisfaction rating of 70 in the United States.
490- More than 300 million users interact with Spotlight content each month.
491- Snapchat says the total time spent viewing Spotlight content has increased by 55% year-over-year.
492- The daily average time spent by Snapchat users aged 35 and older engaging with Shows and Publisher content has increased by over 40% compared to the previous year.
493- More than 300 million Snapchat users interact with Snap Map each month.
494- The longest Snapchat streak was recorded for 2794+ snaps.
495- Snapchat’s swipe-up rate is 5x higher than normal social media click-through rates.
Snapchat Business Stats
496- Snap generated $1.13 billion in revenue for the quarter, a 6% increase from the
previous year, with a significant portion coming from the US market.
497- Friends of Snapchat users have 4X more influence on their purchasing decisions compared to celebrities or influencers.
498- Snapchat+ subscriptions have over 1.5 million paying subscribers.
499- Snapchat users are 60% more likely to make impulse purchases.
500- Together, Millennials and Gen Zs have a spending power of over $1 trillion, and Snapchat’s user base has a combined spending power of $4.4 trillion.
501- Snapchat users are 60% more likely to make impulse purchases.
502- 39% of Snapchat users consult with friends and family before making purchases.
503- Snapchat users are 2X more likely to share their purchases with others.
504- Snapchat accounts for less than 2% of the US digital advertising market.
Snapchat Ads Insights
505- Snapchat has the potential to reach 557.1 million people through advertising.
506- Gen Z users show a 59% advertising recall after engaging with an advertisement for two seconds or less.
507- 39% of Snapchat’s advertising target audience is within the age range of 18-24.
508- 64% of users watch ads on Snapchat with the sound on.
509- As of 2022, 54.4% of Snapchat’s advertising audience is female, and 44.6% is male.
510- More than 57% of businesses post video ads on the platform.
511- It is estimated that Snapchat will generate $5.87 billion in advertising revenue by 2026.
512- As of July 2022, the number of users marketers can reach with ads on Snapchat increased by 27 million (+4.7%) in three months.
513 Snapchat’s advertising audience reach has grown by 20% over the past 12 months.


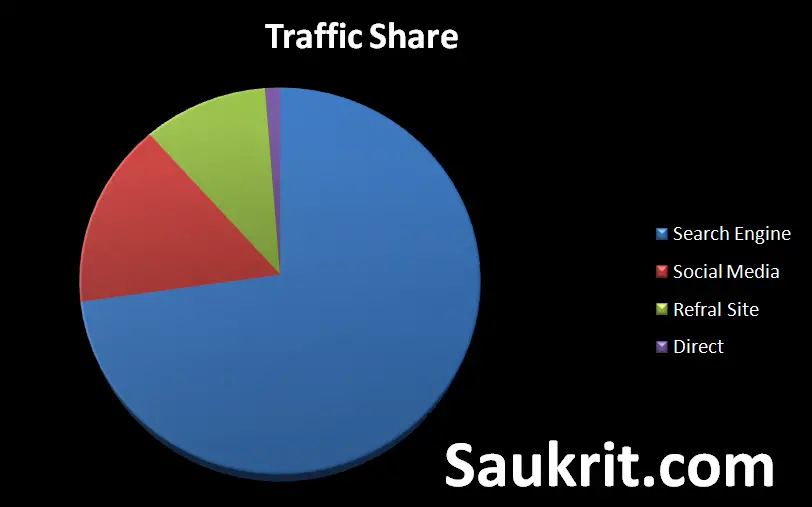
[…] media reach is up to 4.62 billion people. As a result, it is the most important tool after search engines to get quality traffic to your […]
Good site! I truly love how it is easy on my eyes and the data are well written. I’m wondering how I could be notified when a new post has been made. I’ve subscribed to your feed which must do the trick! Have a great day!
media reach is up to 4.62 billion people. As a result, it is the most important tool after search engines to get quality traffic to your [